- Published on
Web application optimization - part 1
- Authors
- Name
- Vinícius Filenga
- @VFilenga


This article is the first part of a series that will feature the optimization of a real world application built using NestJS with Prisma ORM and PostgreSQL.
In this first part, we’ll focus on diagnosing queries generated by Prisma ORM and creating appropriate indexes using migrations.
Pre-requisites
- Docker
- Java 8+
- pgAdmin 4
- JMeter 5.6.2
- node v18.15.0
- git
Pre-work 1: Load testing setup with InfluxDB, Grafana and JMeter
Create a working directory and open it with your favorite command line tool in it, such as:
C:
|_
	Repos
				|_
					LoadTesting (open cmd tool here)
Create docker-compose file
version: '3'

services:
  influxdb:
    image: influxdb
    container_name: influxdb
    ports:
      - '8086:8086'
    volumes:
      - influxdb-volume:/var/lib/influxdb

  grafana:
    image: grafana/grafana
    container_name: grafana
    ports:
      - '3000:3000'
    environment:
      - GF_SECURITY_ADMIN_PASSWORD=your_password
    volumes:
      - grafana-volume:/var/lib/grafana
    depends_on:
      - influxdb

volumes:
  influxdb-volume:
  grafana-volume:
Run your docker-compose and check if containers are running
docker-compose up -d


Access influx db on the browser and set up for UI usage
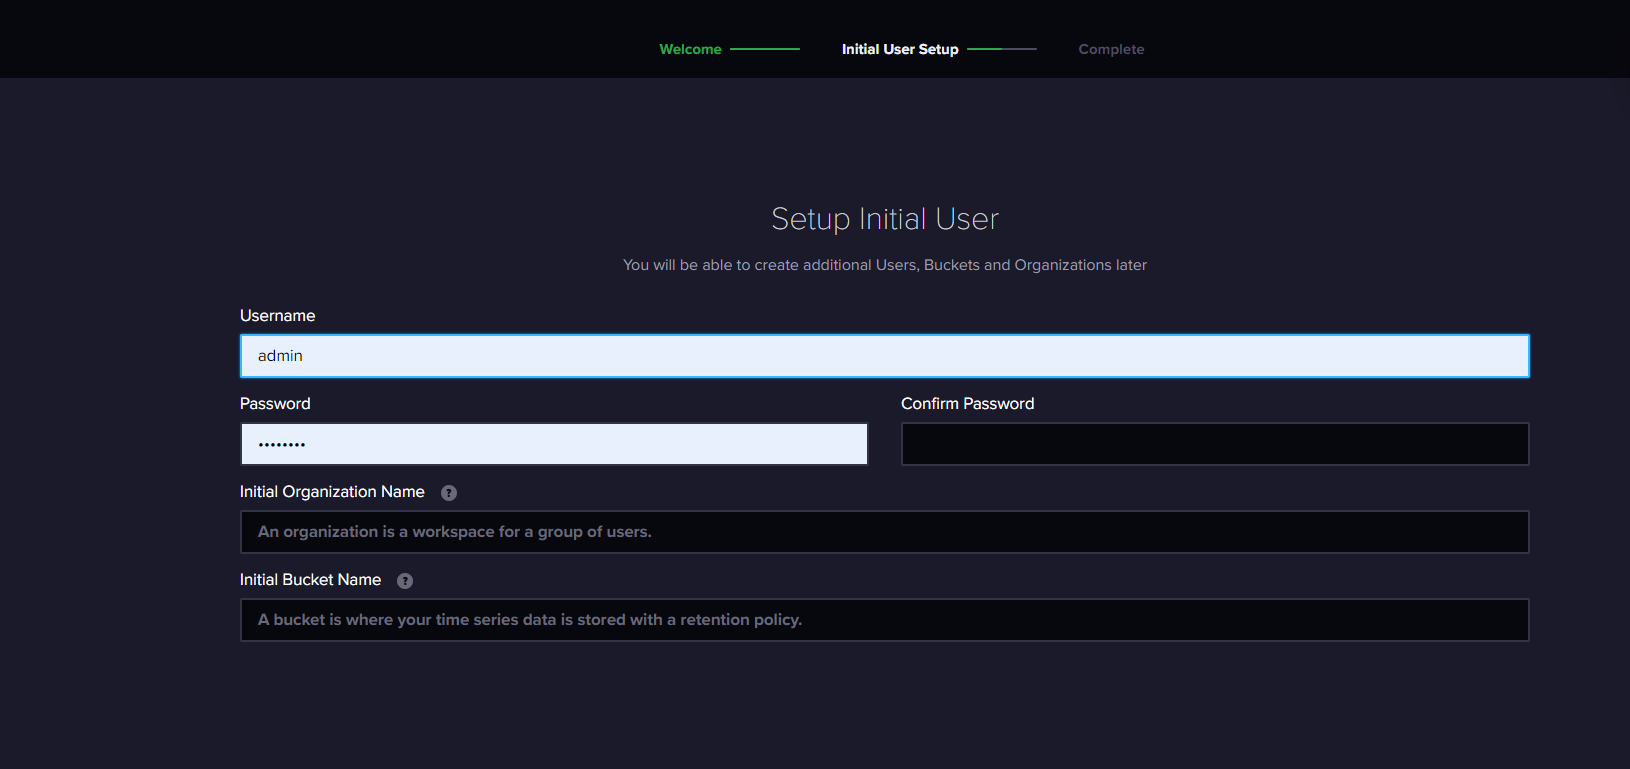
Go to http://localhost:8086/ and finish the set up
Access grafana and add influxdb data source
http://localhost:3000/datasources/new (search for influxdb)
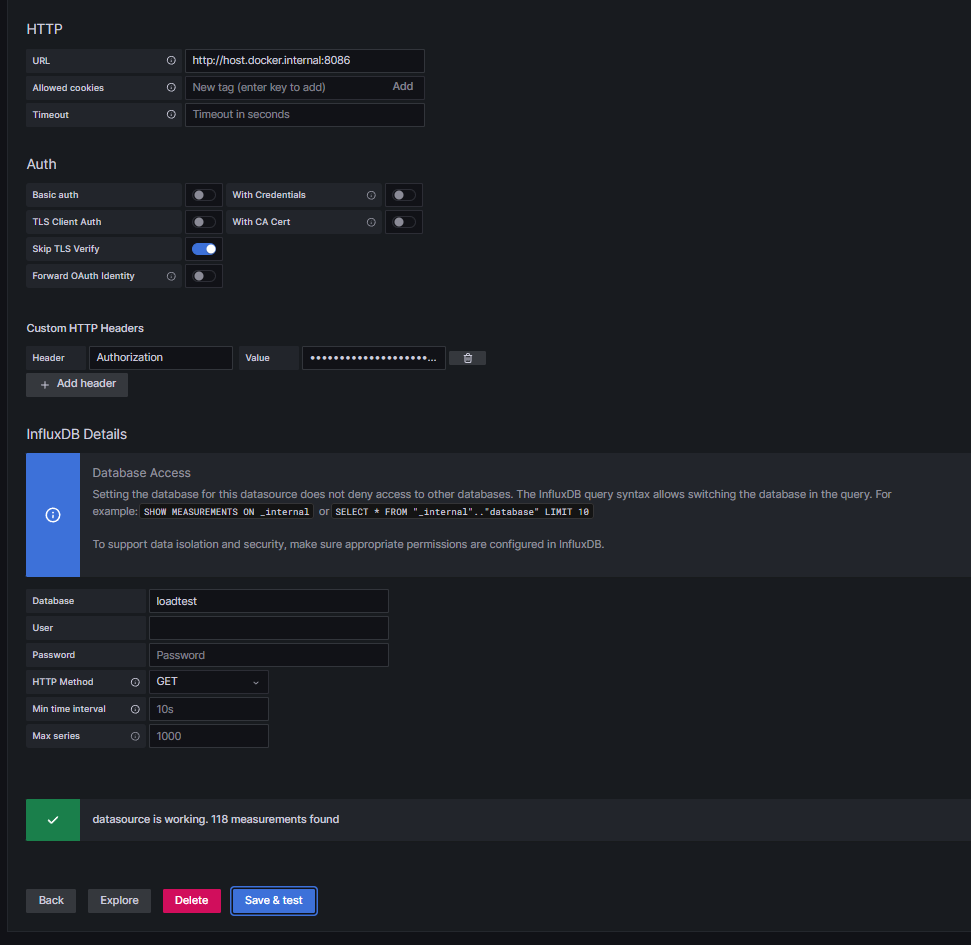
- Auth header format (example)
- Header: Authorization
- Value: Token d2-tdGRjiIN1ybS2au1KgmrKQKpswRtUwCI_xgvTbLMHb5xFpz736T5Ifqk0bEQlMuzryD9SOfFO07p4OKqgag==
- Skip TLS Verify
- InfluxDB Host/Address
- On windows or mac, make sure to use http://host.docker.internal:8086 instead of http://localhost or http://127.0.0.1
Pre-work 2: Prepare NestJS application
https://github.com/filenda/load-testing
clone app repository (ssh example):
git clone [git@github.com](mailto:git@github.com):filenda/load-testing.git
Make sure to checkout main branch:
git checkout main
Go to app directory and install aplication dependencies:
cd seed
npm i
Get database running and seed data into it
docker-compose up -d
npx prisma db seed
After dependencies are installed and database is up & running, wait a few seconds and then run the application:
npm start
At this point, you should be able to access http://localhost:3001/api and see the OAS3 doc of the service.
Pre-work 3: JMeter download and setup (preferably ver. 5.6.2)
- Download it here:
https://jmeter.apache.org/download_jmeter.cgi
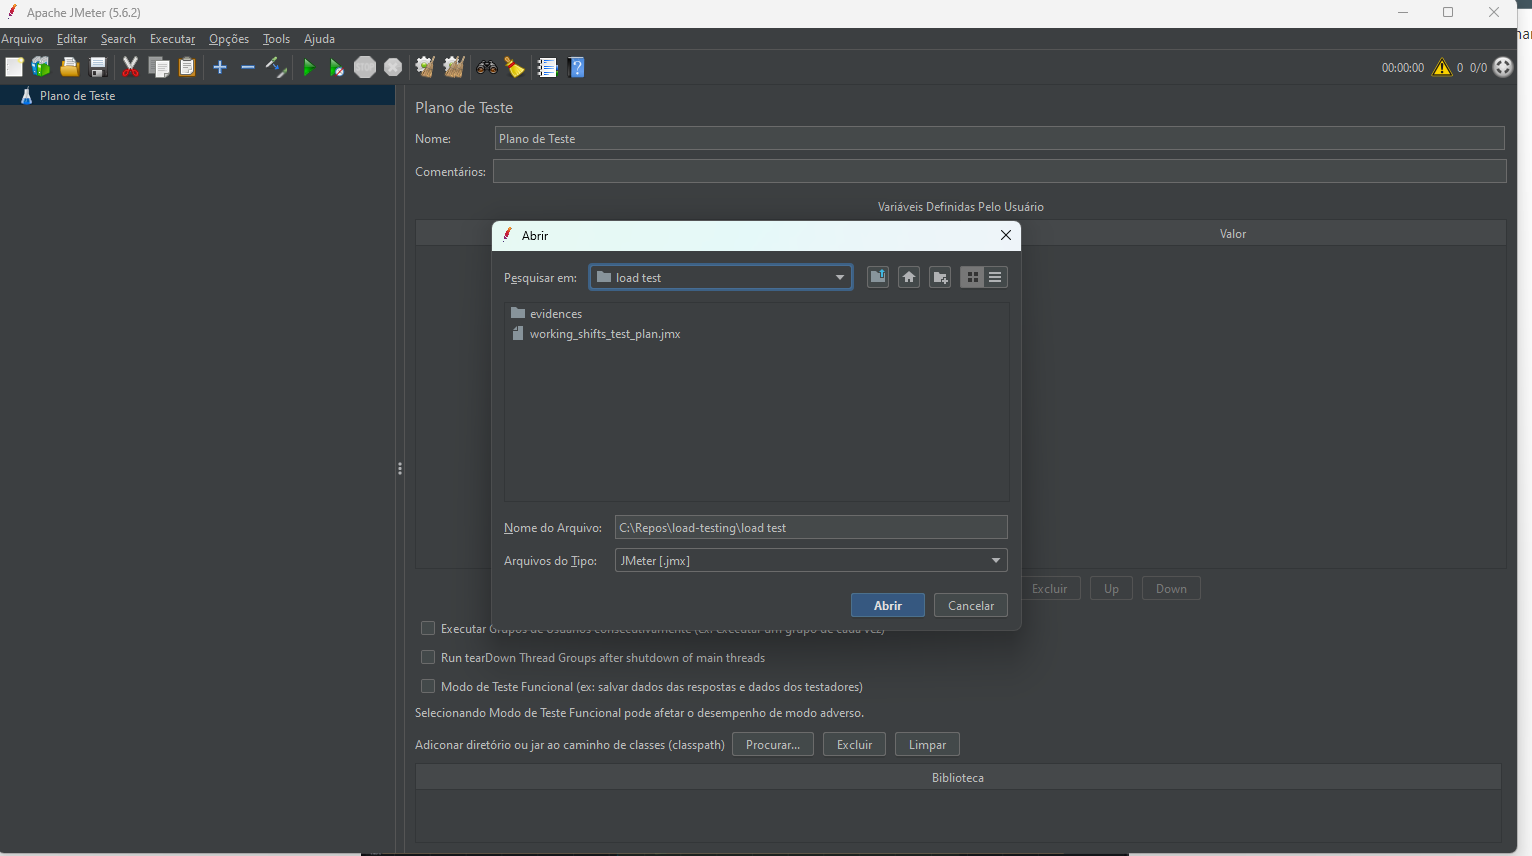
- I already provided the JMeter scripts within the NestJS app repo (in my machine it is C:\Repos\load-testing\load test). With JMeter opened, go to File → Open and open it.
- Download the grafana dashboard template for us to have those fancy charts
- access this address and downlaod the template json: https://grafana.com/grafana/dashboards/5496-apache-jmeter-dashboard-by-ubikloadpack/
- in your grafana instance, open http://localhost:3000/dashboards and go to New → Import
1 - First optimization attempt - Indexes
This phase consists of messing up with basic indexes creation
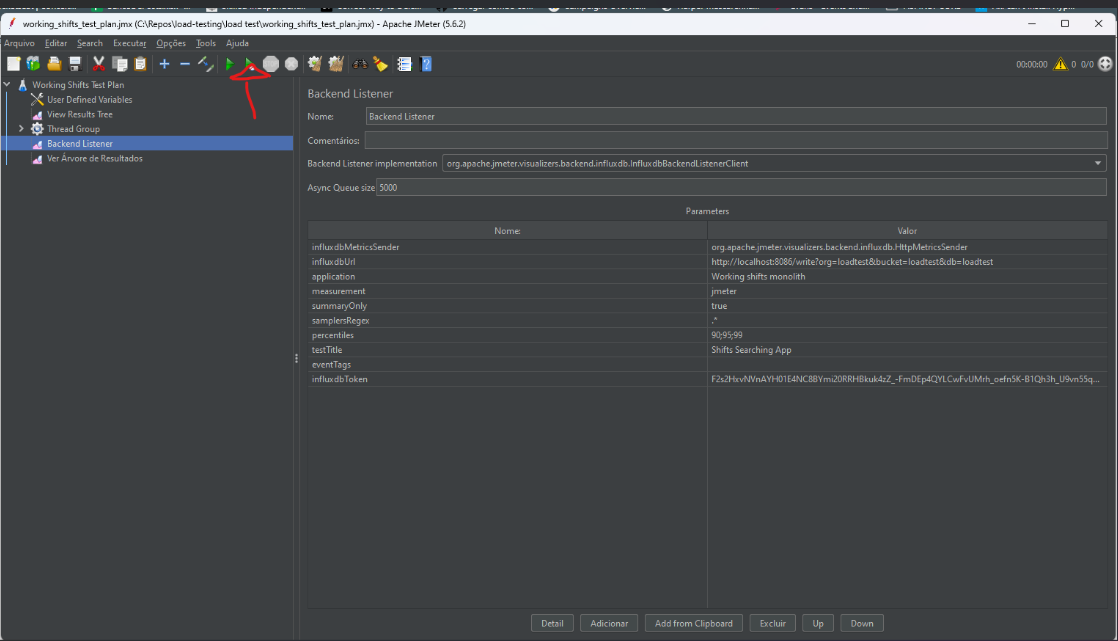
1.0 - Lets run the load tests and see how the application performs “the way it is” (i.e. not optimized)
- with JMeter opened, click the “run unpaused” button
1.0.1 - In the Grafana dashboard, checkl the “Non-optimal database indexes” performance
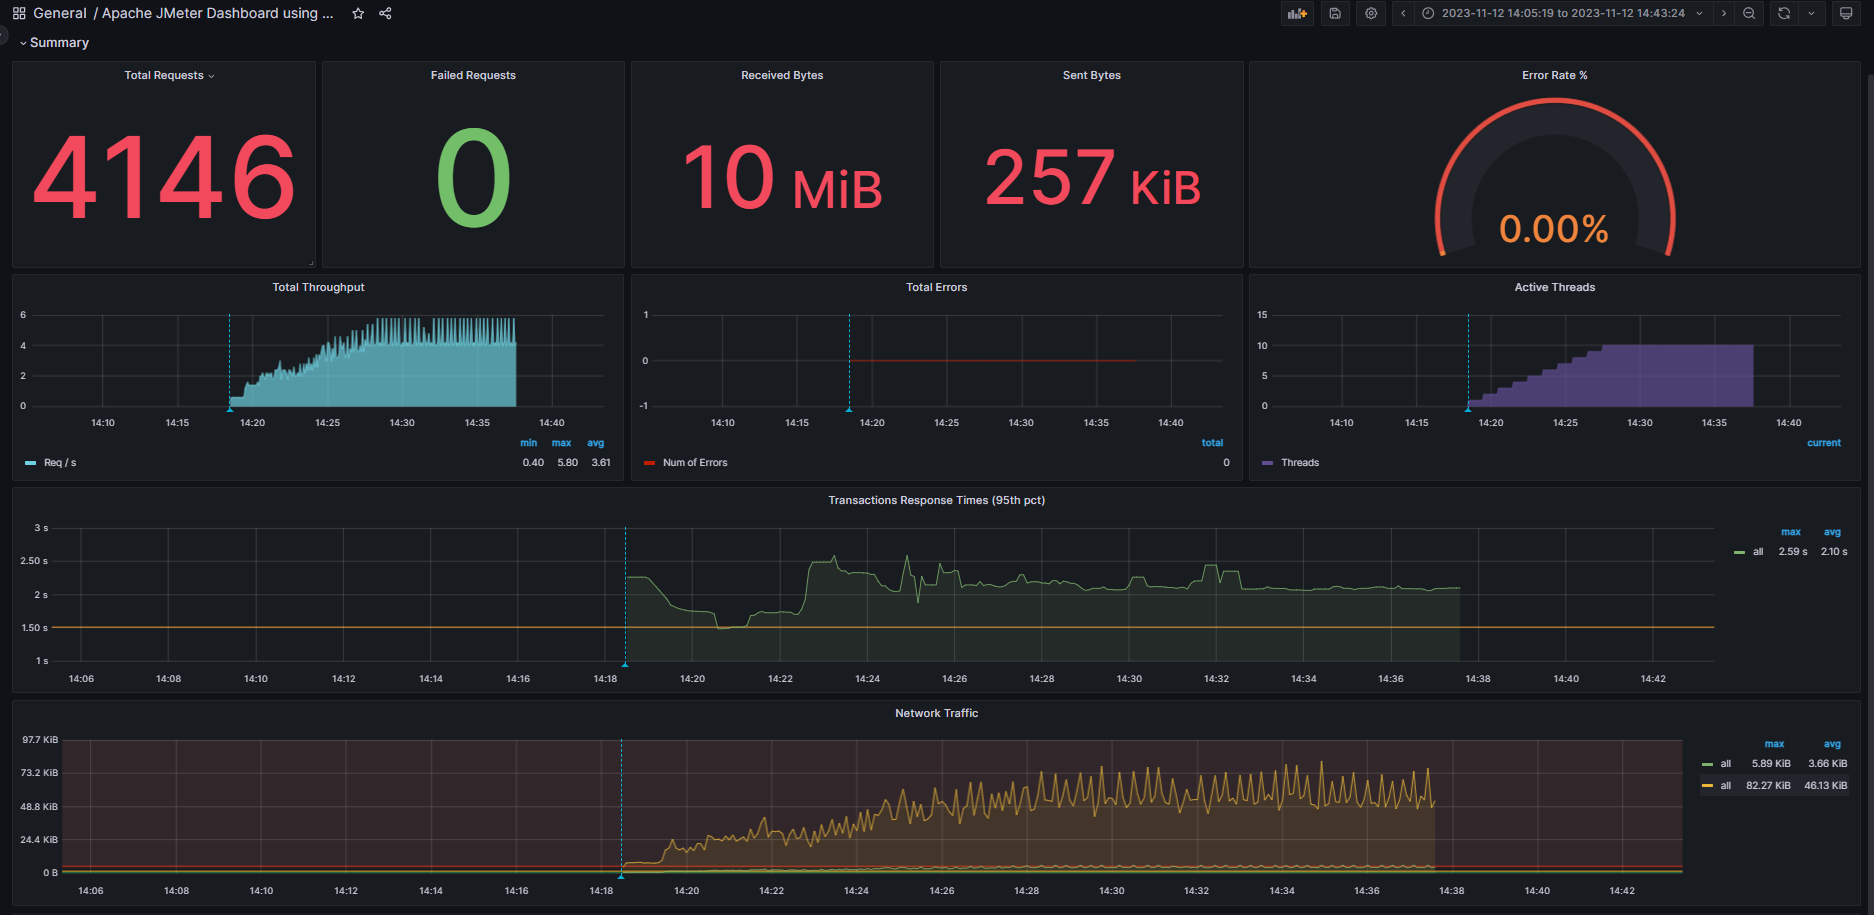
6 TPS at most
1.1 - First, let’s break down que executed queries
1.1.1 - We start by enabling query logging in prisma ORM:
constructor() {
    super({ log: ['query'] });
  }

  async onModuleInit() {
    await this.$connect();

    // eslint-disable-next-line @typescript-eslint/ban-ts-comment
    // @ts-ignore
    this.$on('query', async (e) => {
      // eslint-disable-next-line @typescript-eslint/ban-ts-comment
      // @ts-ignore
      console.log(`${e.query}, ${e.params}, ${e.duration} ms`);
    });
  }
Prisma (ORM) query log
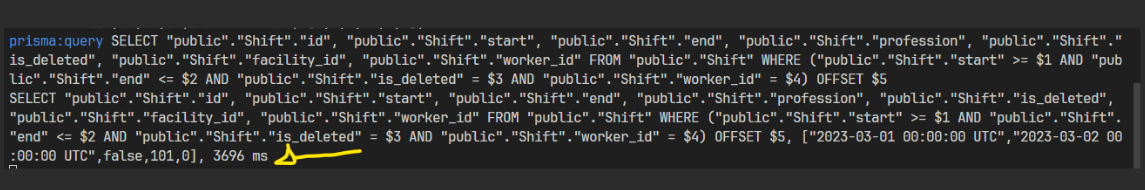
Now you will be able to see queries generated by prisma in the console log
1.1.2 - Clone this Prisma ORM query builder helper tool
clone this repo: https://github.com/filenda/node-sandbox
run
npm ion the root of it to install dependencies (you may need to runnpm initbefore)open the index3.js file inside of it
change these two variables according to what you want to optimize. Example:
const queryString = 'SELECT "public"."Shift"."id", "public"."Shift"."start", "public"."Shift"."end", "public"."Shift"."profession", "public"."Shift"."is_deleted", "public"."Shift"."facility_id", "public"."Shift"."worker_id" FROM "public"."Shift" WHERE ("public"."Shift"."start" >= $1 AND "public"."Shift"."end" <= $2 AND "public"."Shift"."is_deleted" = $3 AND "public"."Shift"."worker_id" = $4) OFFSET $5';

const valuesArray = ["2023-03-01 00:00:00 UTC", "2023-03-02 00:00:00 UTC", false, 101, 0];
run
node index3.jsin the terminal to have access to the raw query you want to optimize:
1.1.3 - We’ll follow this cheatsheet to optimize each query we want to
- Get the raw query
- Open a transaction (in case your query is an update, insert or deletion)
- Choose between
- Explain
- The Explain only runs and brings execution plan based off what the SGBD expects to happen
- Explain & Analyze
- Explain & analyze de facto executes the query (that’s why you wanna use it within a transaction to later roll it back) and compares the expected with what actually hapenned within the SGBD
- Explain
- You can play around with custom settings (make sure you only apply them for your session)
- run EXPLAIN
- SET enable_nestloop = off;
- ALTER … SET STATISTICS 1000;
- ALTER … SET ( n_distincts = ? )
- run EXPLAIN again
- Rollback the transaction
1.1.4 - Let us check queries at last
Execute this call and check the NestJS App console for queries:
curl --location 'http://localhost:3001/worker/101/eligibleShifts?itemsPerPage=100&pageNumber=1&start=2023-02-20&end=2023-03-03'
First query:
SELECT "public"."Worker"."id", "public"."Worker"."name", "public"."Worker"."profession", "public"."Worker"."is_active"
FROM "public"."Worker"
WHERE ("public"."Worker"."id" = 101 AND 1=1) LIMIT 1 OFFSET 0
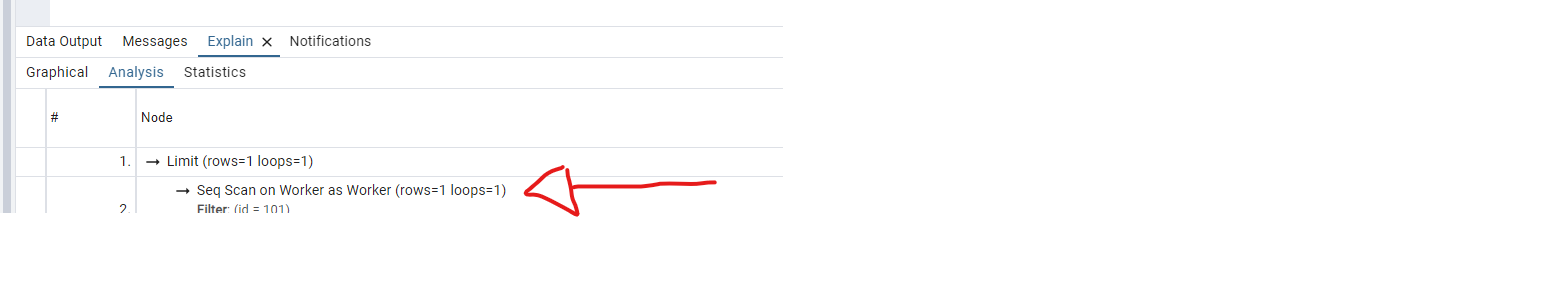
Seq Scan (that is, sequencial scanning, line by line) happening in the Worker table. Can we optimize it?
Technically, yes. You are probably thinking about an index scan in the PK column. But after the seeding of the database, the Worker table end up with a couple more than 100 rows. It is actually computationally cheaper for Postgres to sequencially search line by line in that case. We have to consider postgres internals.
Second query
SELECT "public"."DocumentWorker"."id", "public"."DocumentWorker"."worker_id", "public"."DocumentWorker"."document_id"
FROM "public"."DocumentWorker"
WHERE "public"."DocumentWorker"."worker_id" IN (101) OFFSET 0

We got a seq scan again. Can we optimize it this time?
model DocumentWorker {
  id          Int      @id @default(autoincrement())
  worker_id   Int
  document_id Int
  worker      Worker   @relation(fields: [worker_id], references: [id])
  document    Document @relation(fields: [document_id], references: [id])

  @@index([worker_id], name: "idx_worker_id") //Add this line
}
after applying the migration with the following command on the terminal:
npx prisma migrate dev --name document-worker-worker-id-fk-index
and executing the query again:
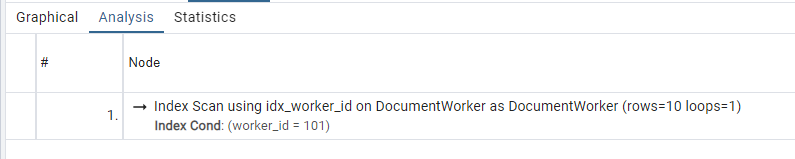
Yay! We got an index scan, finally!
Third Query
SELECT "public"."Document"."id", "public"."Document"."name", "public"."Document"."is_active"
FROM "public"."Document"
WHERE "public"."Document"."id" IN (1,2,3,4,5,6,7,8,9,10) OFFSET 0
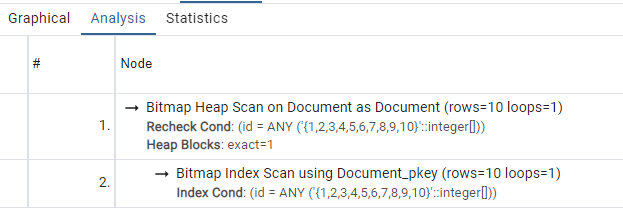
Bitmap Index + Heap Scan
Think of it in terms of a cartesian plane, where the X axis contains all the ids inside the “in” clause, and the Y axis contains all the data of each id. We first search for all ids (that is, x), and then we get all the rest of the data from the Heap area (that is, y). It is computationally cheaper than doing plain index search individually for each id and then union all of them. This can’t get better.
Fourth Query
SELECT "public"."Shift"."id", "public"."Shift"."start", "public"."Shift"."end", "public"."Shift"."profession", "public"."Shift"."is_deleted", "public"."Shift"."facility_id", "public"."Shift"."worker_id"
FROM "public"."Shift"
WHERE
(
	"public"."Shift"."start" >= '2023-02-20 00:00:00 UTC' AND
	"public"."Shift"."end" <= '2023-03-03 00:00:00 UTC' AND
	"public"."Shift"."is_deleted" = false AND
	"public"."Shift"."worker_id" IS NULL AND
	"public"."Shift"."profession" = 'CNA' AND
	("public"."Shift"."id") IN
	(
		SELECT "t0"."id" FROM "public"."Shift" AS "t0"
			INNER JOIN "public"."Facility" AS "j0" ON ("j0"."id") = ("t0"."facility_id")
		WHERE
		(
				"j0"."is_active" = true AND
				("j0"."id") NOT IN
				(
					SELECT "t1"."id" FROM "public"."Facility" AS "t1"
						INNER JOIN "public"."FacilityRequirement" AS "j1" ON ("j1"."facility_id") = ("t1"."id")
					WHERE
					(
						(
								NOT ("j1"."id") IN
							(
								SELECT "t2"."id" FROM "public"."FacilityRequirement" AS "t2"
									INNER JOIN "public"."Document" AS "j2" ON ("j2"."id") = ("t2"."document_id")
								WHERE ("j2"."id" IN (1,2,3,4,5,6,7,8,9,10) AND "t2"."id" IS NOT NULL)
							)
						) AND "t1"."id" IS NOT NULL
					)
				) AND "t0"."id" IS NOT NULL
		)
	)
)
ORDER BY "public"."Shift"."id" ASC LIMIT 100 OFFSET 0
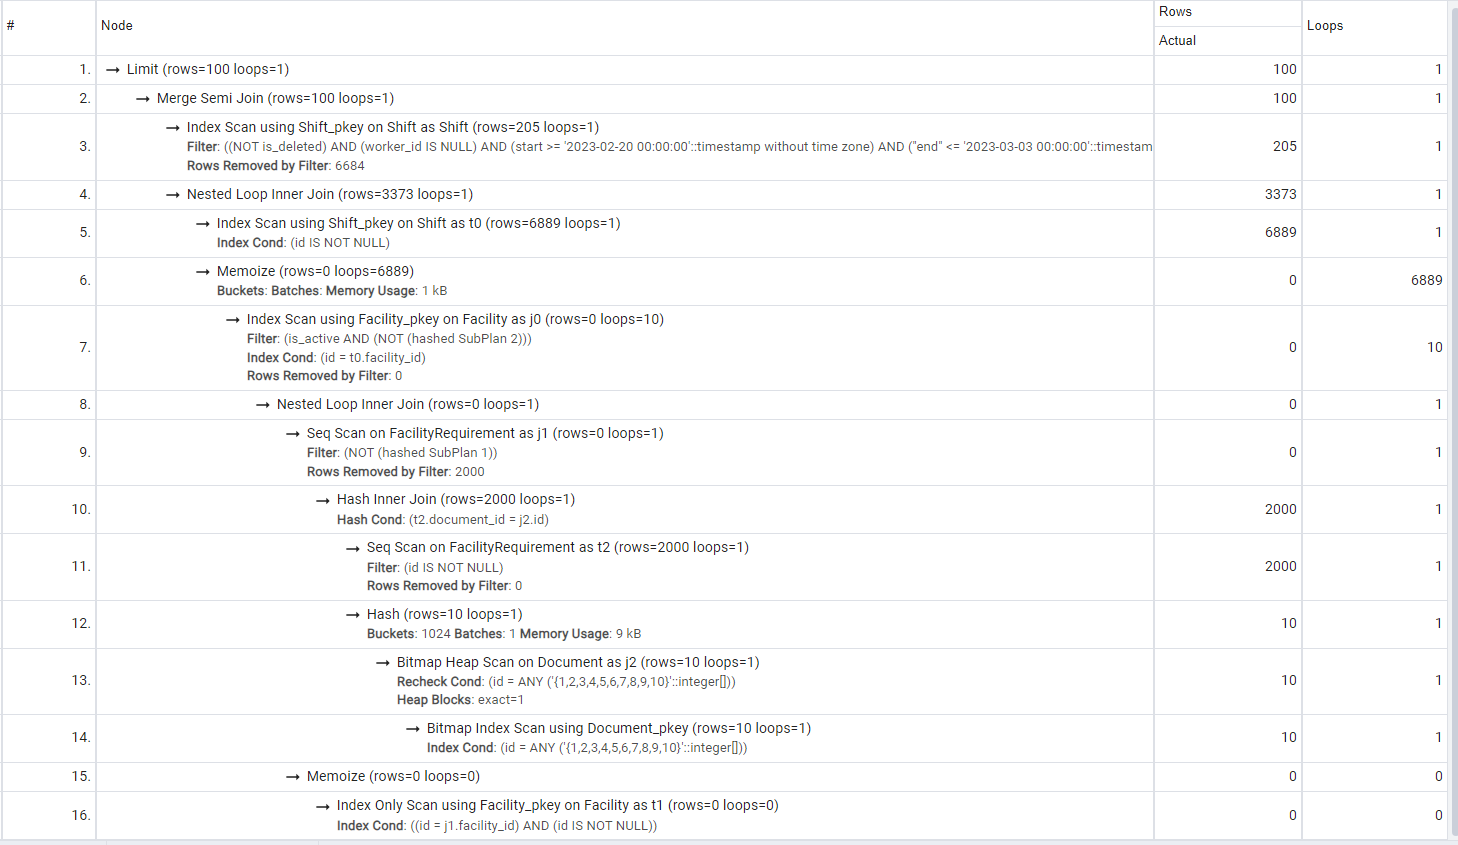
What can we observe?
- #11 is doing an unnecessary seq scan. It is filtering out nullable ids that are already non-nullable primary keys on the FacilityRequirement table. We’ll leave it there for later improvements.
Fifth Query
SELECT
	"public"."Facility"."id",
	"public"."Facility"."name",
	"public"."Facility"."is_active"
FROM
	"public"."Facility"
WHERE
	"public"."Facility"."id" IN (3,7,2,10,6) OFFSET 0
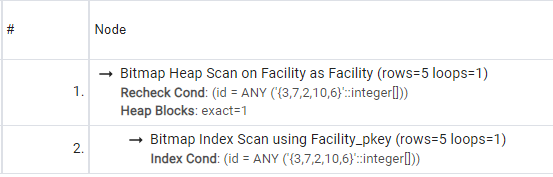
Bitmap Index + Heap, as we saw before in another query
Sixth Query
SELECT
	"public"."Shift"."id",
	"public"."Shift"."start",
	"public"."Shift"."end",
	"public"."Shift"."profession",
	"public"."Shift"."is_deleted",
	"public"."Shift"."facility_id",
	"public"."Shift"."worker_id"
FROM
	"public"."Shift"
WHERE
(
	"public"."Shift"."start" >= '2023-02-20 00:00:00 UTC' AND
	"public"."Shift"."end" <= '2023-03-03 00:00:00 UTC' AND
	"public"."Shift"."is_deleted" = false AND
	"public"."Shift"."worker_id" = 101
)
OFFSET 0
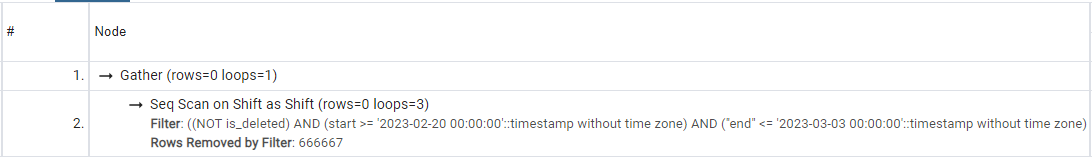
Seq Scan + Gather operation
- Both in this sixth query and in the fourth one (check earlier in the article), we see the shifts table receiving queries on these columns: start, end, is_deleted, worker_id, profession.
Let us add a composite index to the table, consisting of these columns:
model Shift {
id Int @id @default(autoincrement())
start DateTime
end DateTime
profession Profession
is_deleted Boolean @default(false)
facility_id Int
worker_id Int?
worker Worker? @relation(fields: [worker_id], references: [id])
facility Facility @relation(fields: [facility_id], references: [id])
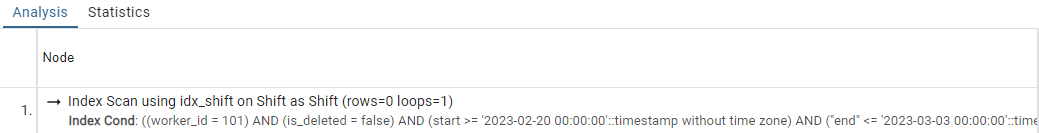
@@index([worker_id, is_deleted, start, end, profession], name: "idx_shift")
}
apply the migration with the following command on the terminal:
npx prisma migrate dev --name shift-index
Execute the query again and see that now we get an index scan (yay!):
Comparing results (remember to run the JMeter load tests again)
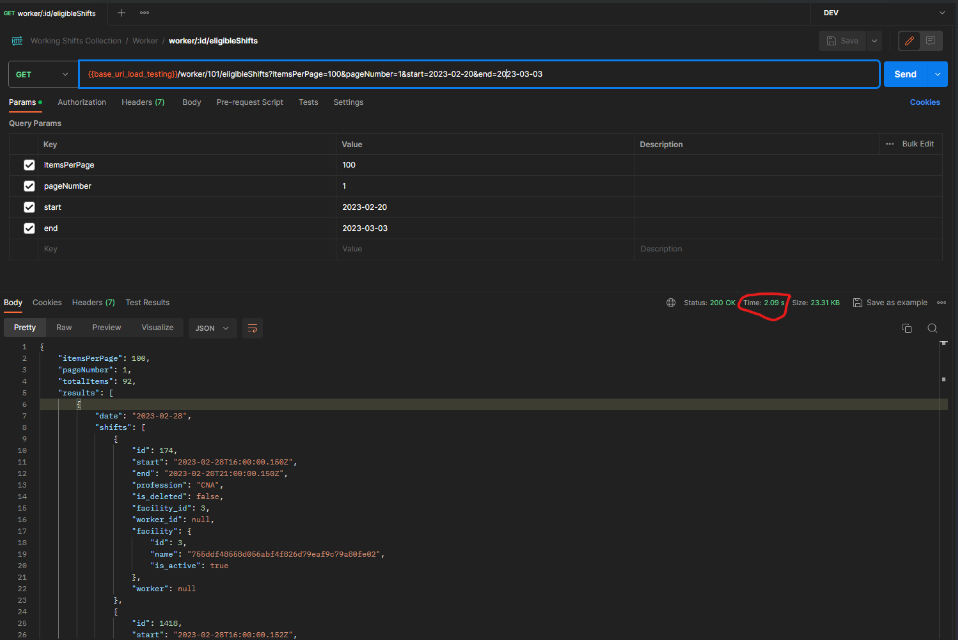
BEFORE: Isolate request taking 2.09s
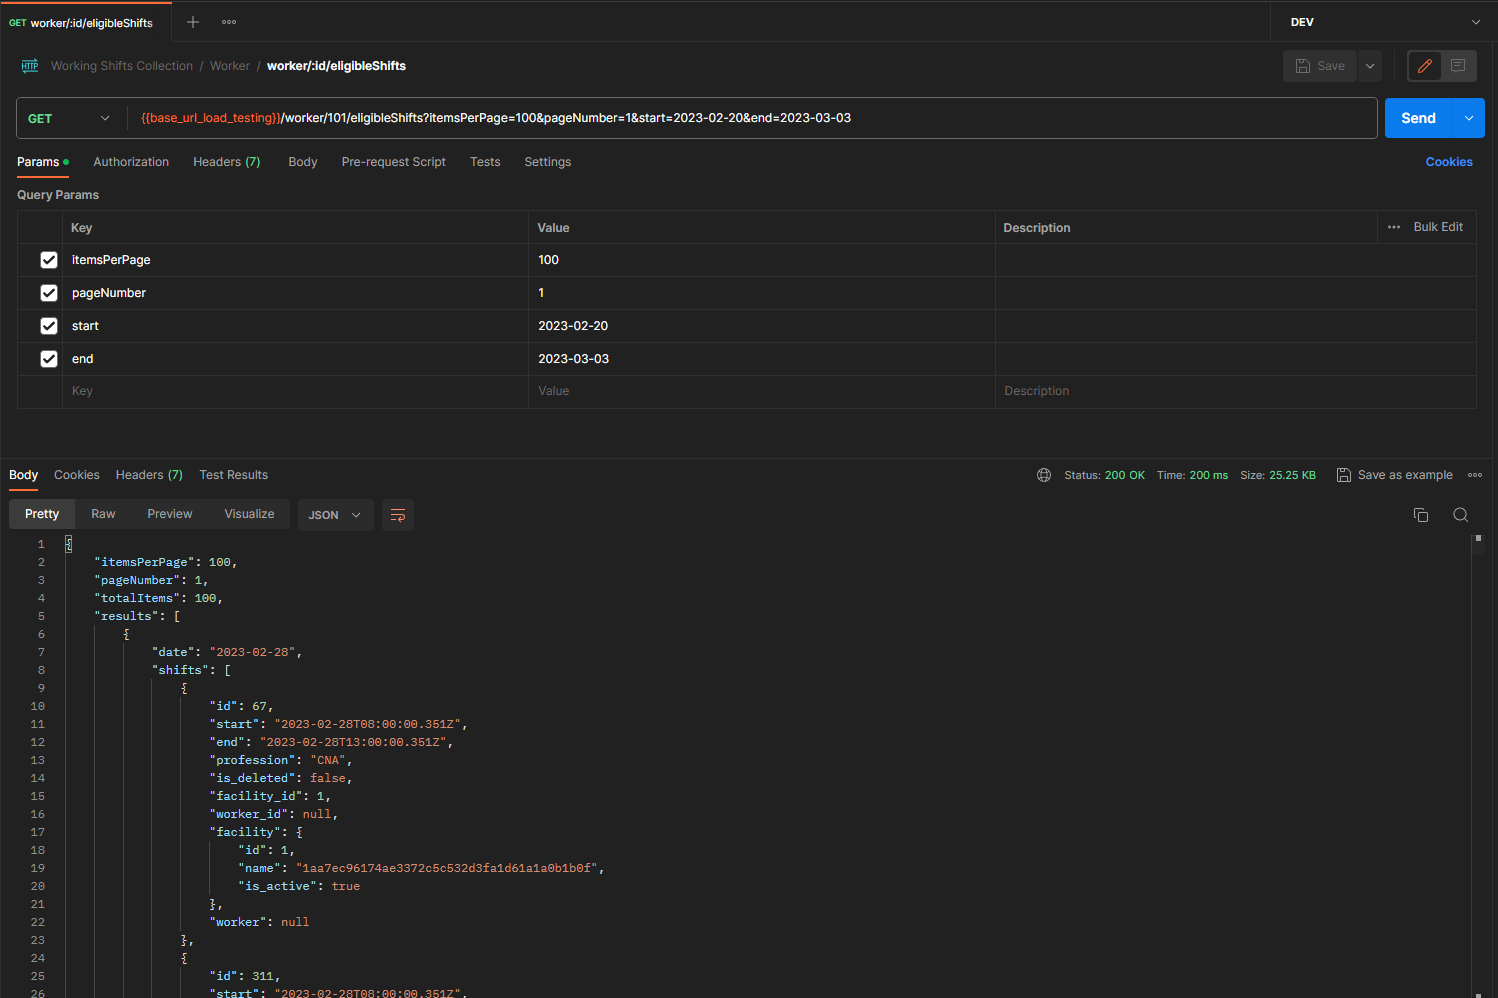
AFTER: Isolate request taking 200ms (!!!)
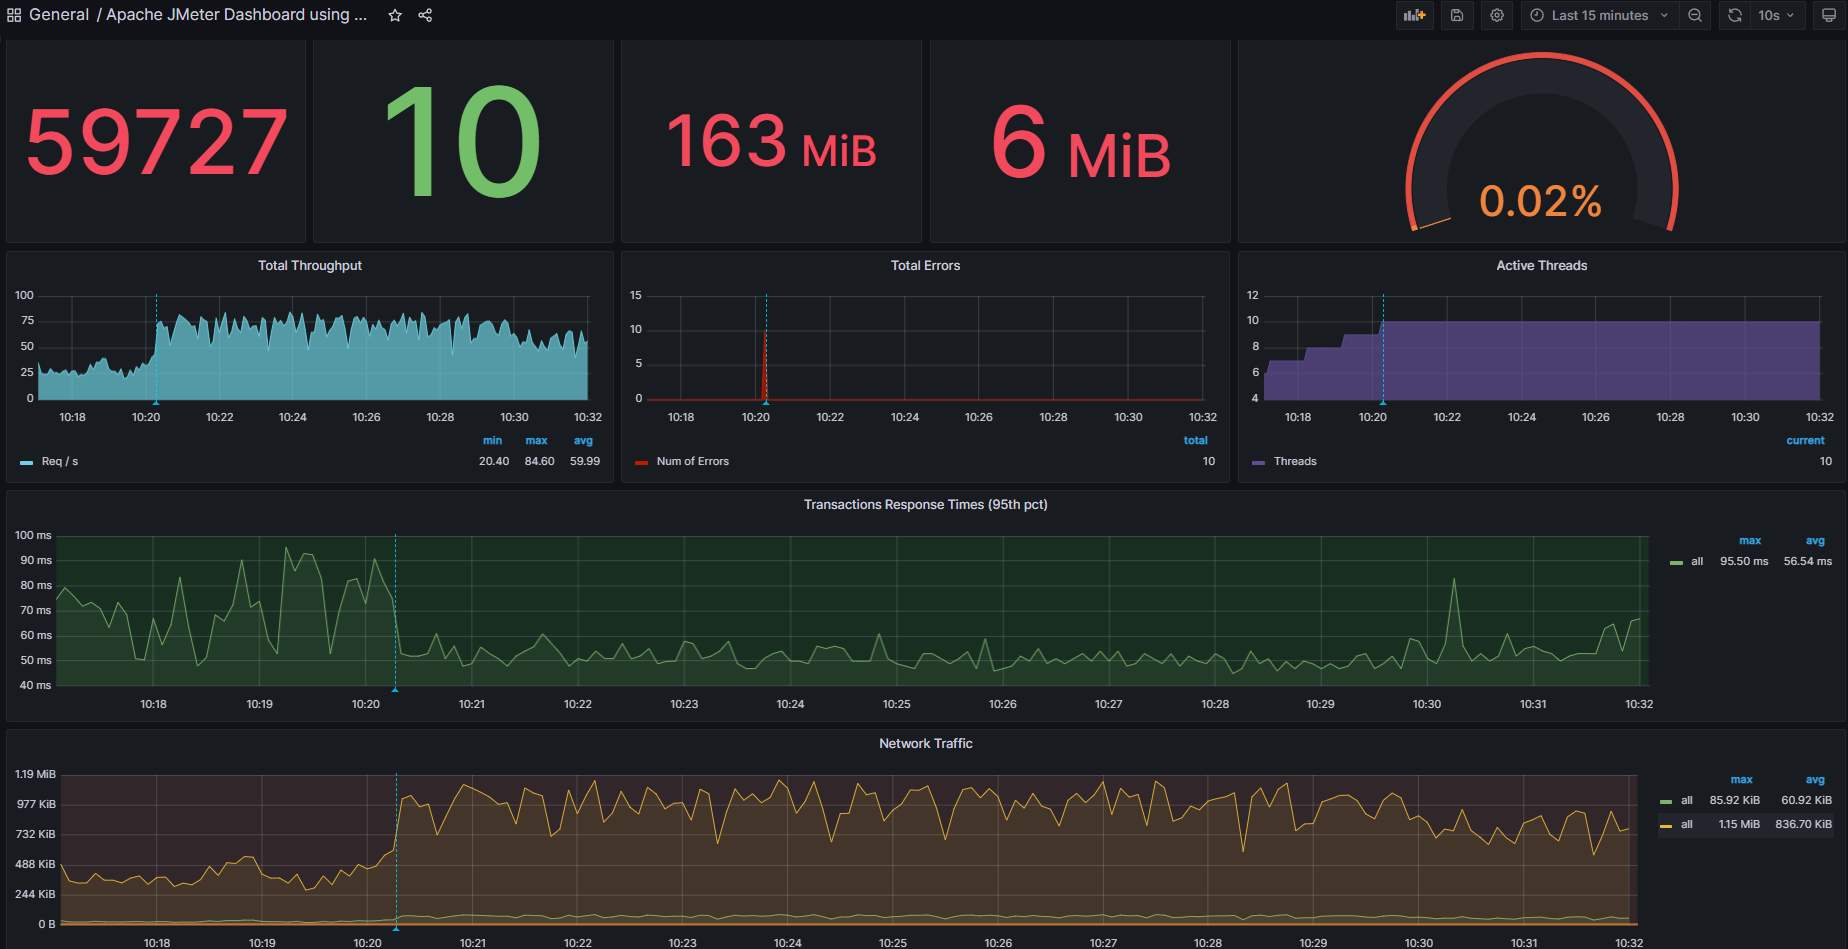
84 TPS PEAK (from 6 TPS before optimizaiton - check the beginning of the article)
To be continued
- Code (ORM and logic) optimization
- Docker Network (bridge vs host mode)
- Production deployment (removal of logging and debugging stuff, plus adding observability tool)
Contributions are welcome
The giscus plugin is still not configured on the blog for you guys to comment (shame on me for that T_T). But, in the mean time, feel free to reach out to me on Linked or X/Twitter (links in the blog footer)
Happy 2024!